
When I created the initial design I thought I was being overly ambitious. Making a goal of financial sustainability in less than 3 years of any project’s creation is asking a lot. Asking that of a land based permaculture project is even more ambitious… fold in the dynamics of a community living situation and you’re just asking for trouble. Yet, after only a single month from the implementation of Open Book Management the results clearly demonstrated a potential beyond anything I could have imagined.
The evaluation of this work demonstrates the amazing potential of game theory in financial and management design. I feel it is important to note that I am no more an expert at data analysis than I am at financing. This is something I have only begun to explore. Typically my response to numbers, math, carts and data of any kind is one of recoil. But I present this information out of interest for its potential within permaculture design and implementation. Financial systems are lacking from almost every design I have encountered and I feel strongly that the result of this omission has been detrimental to the implementation of successful projects. Not only do I believe there to be important advantages to designing the financial aspects of a project — I believe in designing those systems to be fun, interactive and goal oriented. I think the following data will show the advantages of this design approach.
Month in Review
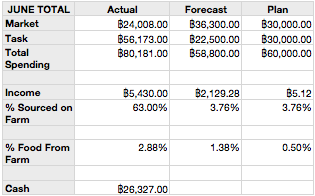
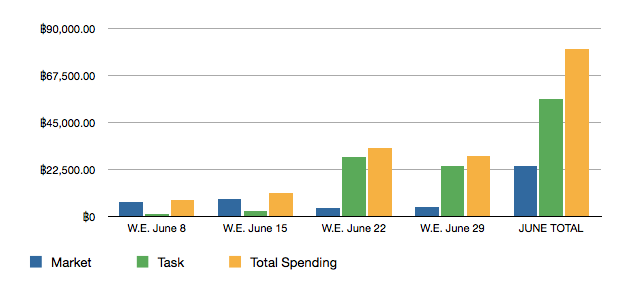
Let’s start by taking a look at the monthly totals for June. In the previous section (Implementation) you can view the weekly charts and see how the system performed during the process of implementation. For now let us zoom out and take a look at the larger picture.
Spending
You can see for the month of June that the spending is quite high. Total Actual Spending for the June was over 80,000 THB. Unfortunately, I do not have the detailed break down of the spending for the month and cannot give exact figures but I do know that a majority of that spending was for setting up our new dorm space and purchasing materials and food for two courses near the end of the month. Much of that spending was to be reimbursed by the course income (not tracked on the Rak the Budget Board as previously mentioned) and was not a part of our normal monthly spending.
No “games” were played around the spending lines of the board so any spending over the Plan was not an issue so long as we had the money on hand to spend. The reason we chose not to frame any games around the spending lines was simple logic learned through the course of using the previous scoreboard (Big Board o’ Budget — See the Design section). The reason to avoid a game in regard to spending was to avoid issues where we might incentivize spending reduction at the cost of the community or the project’s wellbeing.
In this case, we had the money to spend, the materials were needed to host the additional people coming to take part in the course, and the spending did not harm the community in any way. Additionally, because we used the Open Book Management system and meet
weekly to go over the finances, everyone was informed and had a clear understanding of why the spending had increased, what it had gone to and what that might mean for the community.
Income
The income for the month of June showed impressive results. Here the game was not only to grow the income but to source as much of the income from the farm as possible. This game created a wealth of discussion about possible income sources, various ventures and spurred a whole entrepreneurial spirit within the community.
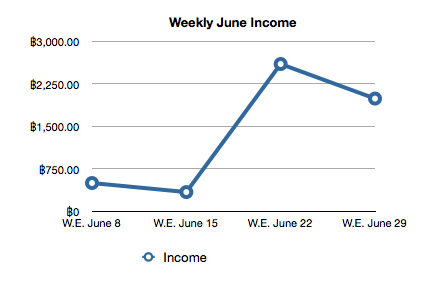
June income rose sharply over the course of the month for several reasons. One reason was the arrival of our course participants and their thirst for our freshly brewed Kombucha and Ginger Beer. The other is because we had Kombucha and Ginger Beer brewed and ready for their arrival. We also had soap and a few other products produced and ready for sale to our new guests.
A view of the months leading up to June shows more valuable information about how the game influenced performance on this important metric.
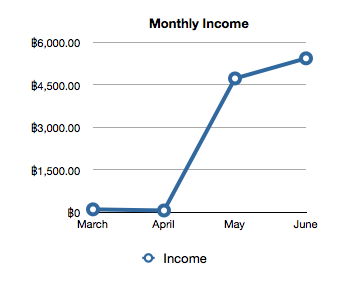
As you can see, the months leading up to June had relatively little income. March had 100 THB income because we had a visitor who paid to reimburse for food costs during their stay. That was the first income we generated as a community on the farm. The next month, April, we had no income at all. In may, the income rises sharply for two reasons. We had a several visitors come to stay with us during that month and, interestingly enough, we learned from our previous guest experience that charging a nominal fee for guests made sense (we were still only charging just enough to cover average food costs per person). Secondly, we collected all the scrap metal we could find around the farm as part of our trash cleanup and recycled it. This netted us a little over 3000 THB and was not motivated by the desire to generate income, but rather, to clean up our space.
It is not until June where we see a rise in response to the motivation of the game. Here, income was sourced from a variety of different products and ventures. New ideas and improvements to old ideas to generate more income were developing almost daily.
The income line, if you remember, was already something everyone was familiar with from the previous scoreboard. And yet, it was not until there was a clear goal, an incentive to reach that goal, and an incremental challenge to improve over time that behaviors had any marked change.
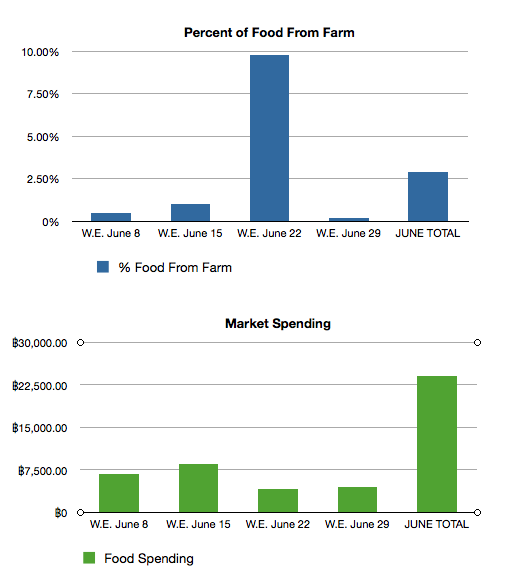
Percent of Food From Farm
The Percent of Food From Farm was a metric to gage how much food we were harvesting verses how much we bought from the market. The metic was measured by weight each week not by spending (as it is impossible to measure the spending of food harvested from the farm). In the charts below, thought it would be interesting to match the percentage of food we harvest from the farm in weight with the amount of money we spent at the market on food.
 The idea with creating this game was to reduce the amount of spending at the market without incentivizing the community members to avoid buying the items that were needed. Instead, if we could increase the amount of food produced on the farm we would accomplish many goals at once. As a permaculture project, an inherent goal was to produce good quality food for ourselves and surrounding community. This game created an incentive to help achieve that goal. Other goals included teaching people how to produce food for themselves, how to manage a farm, how to be sustainable on a piece of land, etc… etc…
By looking at the results of this graph you can see that as our percentage of food from the farm increased, our spending at the market decreased. A couple elements that are not made visible by these graphs are: The increase in spending on W.E. June 15th is the result of a large monthly purchase of bulk flour, rice, oil and sugar. These essentials needed to be purchased in advance of the upcoming course. Even given the large increase in spending (and weight of these bulk purchases) our harvest from the farm increased to 1%. The next week sales drop again, this time below the already low week of June 8th, while the harvest from the farm increase to nearly 10%. This, I believe, is the best indicator that the system was a success.
Sadly I do not have any data on the amounts of food we harvested prior to the month of June. We simply have to go with the sentiment that we had missed many opportunities to harvest what was available. We had even been reproached for not harvesting ripe mangos but instead letting them go unnoticed and rot under the tree.
Improvements
Although I think this data shows very impressive results I am eager to try this methodology under deferent conditions were I will be able to run the game for longer and produce more resolute data. There were many factors that lead to this project not living up to the potentials I think were possible. This is a brief evaluation of areas were this design fell short and/or could be improved upon in future design work.
One of the biggest hinderances to the success of this project was not having the full financial picture available. Ideally, with any business, whether it be a farm, an education centre, or a bakery, the full financial picture needs to be clear in order to plan effectively. With this project, there were many aspects of the finances that were not fully transparent. The farm itself was managed by the Thai family of which no financial elements were made available. We had no context for how farming operations were being managed, what costs were associated and what revenue was generated through these operations. Likewise, the infrastructure development (construction costs of buildings, furnishings, etc…) were not provided and had to be omitted.
Given the already incomplete financial picture we were working with, and a goal stated in the Master Plan that mentioned wanting the farm to be financially sustainable without the need for income through educational elements, I was motivated to keep course finances separate from the design. In retrospect, I would have liked to have these metics at least have some representation on the Rak The Budget scoreboard as I think it would have given the community a much more complete picture and given us a better understanding of how to achieve our goals.
Aside from having all the information included in the design, there was at least one other major factor that inhibited this project from living up to its fullest potential. The fact that I had designed and implemented the scoreboard during a time of such dramatic transition within the community was a major factor in its lack of endurance. During the month of June all of our initial internships were coming to an end. We had only two interns from the initial batch staying on, and only one of the new interns had been through one of the financial meetings. At the same time, for a variety of reasons, I had chosen to no longer continue my position as a manager. I did my best to hand off the system to the new incoming intern that showed an interest in taking on the financial systems but it was too little too late. Trying to demonstrate the value and importance of this system as well as how it functioned in an afternoon was not going to provide the momentum needed to sustain its use. Sadly, this design is no longer in use at Rak Tamachat.
In the future I also hope to collect more data and be able to provide more evidence of the profound impact a creative and interactive financial design system can have on the success of a community or project. Tracking data over time and being very clear with the various details can show a much more convincing picture that I have been able to provide here (although, given the challenges, I feel this research is still compelling enough to warrant much deeper analysis). Also, creating a better environment to cultivate more involvement from members of the community to take on roles such as recording and tracking information early on would be a great improvement to attempting to work out all the various tasks myself.
Conclusion
Although there is clear room for improvement in this design, I have no doubts in the potential of Open Book Management as I have seen the results first hand in my management experience at Wheatsville Co-op in Austin, Texas. Having the opportunity to implement Open Book Management into this new context has giving me a great deal of hope and inspiration that permaculture projects and eco-villages can have a simple solution to one of the most traditionally encumbering challenges to their ability to succeed.
I believe that this simple and effective approach to financial management can be one of the most powerful tools for regenerative design available. By dissipating the fear and apprehension many people feel around economic systems and providing a space for human creativity to flourish we can dramatically increase the rate of success of permaculture projects, eco-villages and holistically managed businesses. In so doing, we take more of the power from destructive economics and put them in the hands of the healers; we take people away from jobs that they hate, that are destroying the earth, and put them in meaningful positions of landscape regeneration; we take great strides toward removing our subsistence needs from the systems of degenerative economics; and we begin to see the true abundance of possibilities, limited only by our creativity, take form and flight.
Please contact me if you are interested in implementing this financial design methodology to increase the potentials of success for your permaculture or holistically managed project.